Research has consistently found that investment trusts have on average outperformed open-ended funds and unit trusts over the long-term.
One of the most comprehensive recent studies is Mick Gilligan’s Investment Trusts Explained – Your Guide to Successful Investing in Closed-Ended Funds.
The table below compares the cumulative performance of comparable sectors over the long term. It shows that investment trusts have outperformed their open-ended fund equivalents in each category. Whilst the annualised performance differential may appear relatively modest (ranging from 0.7% to 2.0%), when compounded over time these differences translate into substantial total returns.
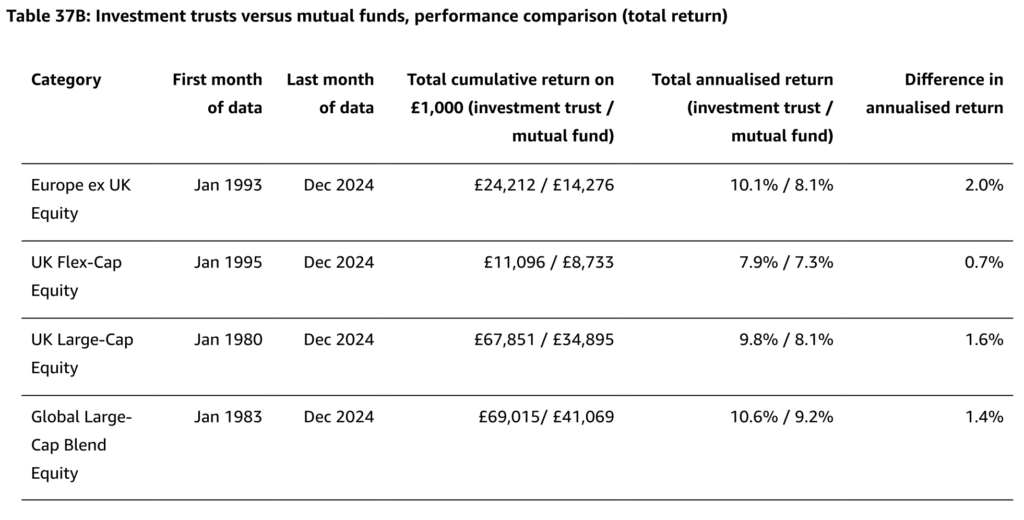
Based on average monthly NAV performance, net of fees, with income reinvested, to 31/12/2024. Full methodology is in the appendix.
Source: Morningstar. Mick Gilligan’s Investment Trusts Explained – Your Guide to Successful Investing in Closed-Ended Funds – Chapter 37 – Do Investment Trusts Outperform Mutual Funds?
Before the Retail Distribution Review (RDR) in 2012, open-ended funds were able to pay trail commissions to financial advisers for recommending their products. Given that most advisers relied heavily on commission-based remuneration, this created a strong incentive to prioritise open-ended funds over investment trusts.
Since the introduction of the RDR, which eliminated commission payments, there is no longer a financial disincentive for advisers to recommend investment trusts. However, a structural bias in favour of open-ended funds persists, particularly within the advice market, despite the clear and well-documented advantages that investment trusts offer.
Ironically, many advisers personally invest in investment trusts whilst continuing to recommend open-ended funds to their clients.
At B&G, we align our interests with those of our clients by investing in our own portfolios. We truly practice what we preach.
Why Now?
As investment trusts are publicly traded companies listed on the London Stock Exchange, you invest in them by buying shares at the price stated – the share price. However, investment trusts also have a net asset value (NAV). The NAV represents the total value of the trust’s assets minus any debts, and dividing this by the total number of issued shares gives the NAV per share. If the share price is higher than the NAV per share, the trust is trading at a premium, indicating high investor demand and popularity. Conversely, if the share price is lower than the NAV per share, the trust trades at a discount, suggesting lower popularity and demand. When the share price equals the NAV per share, the trust trades at par.
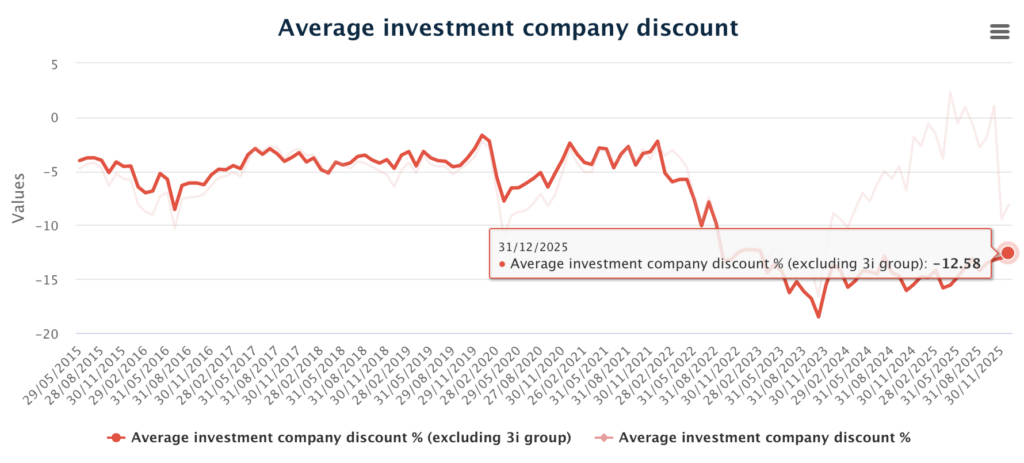
Source: AIC/Morningstar
The chart above highlights that the sector average discount at the end of 2025 was -12.6%. According to research from the AIC, investing when the average investment trust discount is more than -10% may lead to significantly better returns over the subsequent five years. The AIC’s analysis of investment trust returns since 2008 shows that when the average discount exceeded -10%, the average investment trust generated a return of 89.3% over the following five years¹.
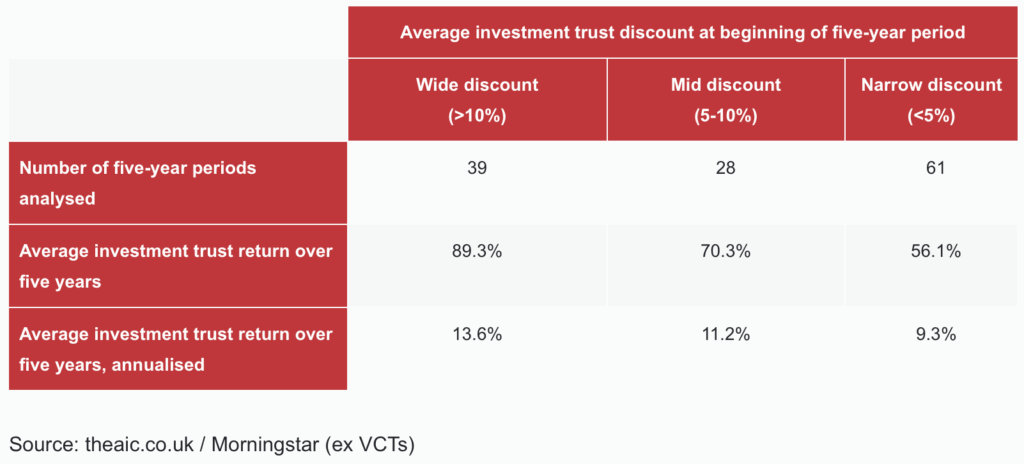
¹Source: theaic.co.uk/Morningstar. Based on an analysis of 128 five-year periods, the first period ended in June 2013 and the final in January 2024 (all periods start and end at a month-end).
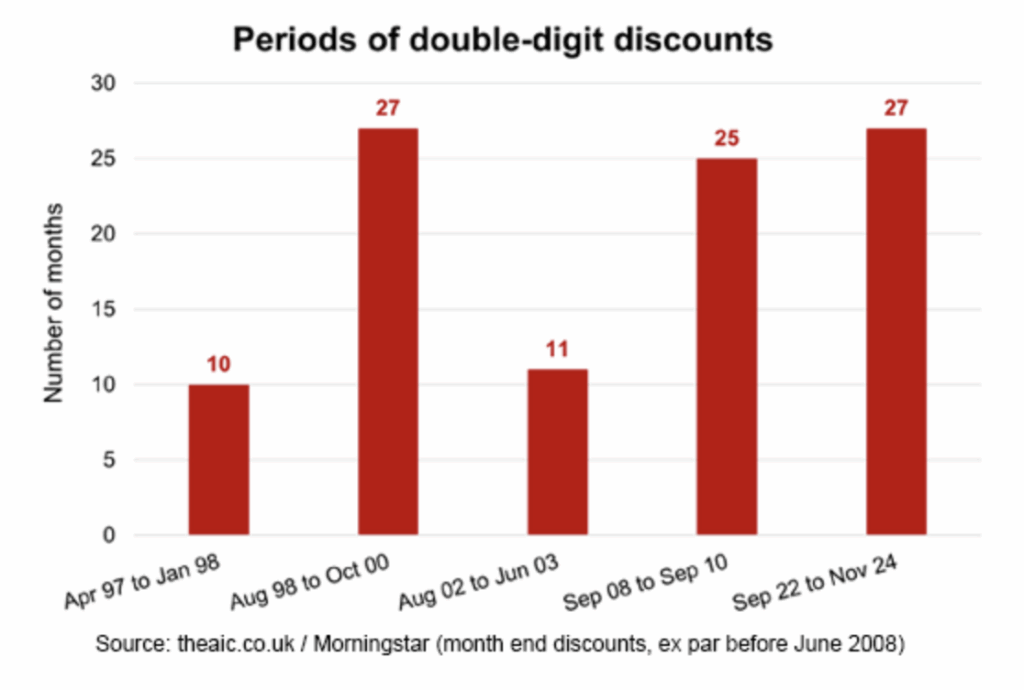
Bargains, but for how much longer?…(as shown by the chart below) periods of double-digit discounts come to an end eventually. This one has lasted a draining 27 months…two months longer than the one we saw during the financial crisis.
Once sentiment turns, a rising NAV and a narrowing discount are a powerful combination – they have a ‘double whammy’ effect on performance.
To use a straightforward example, an investment trust that sees its NAV increase by 15% at the same time as its discount narrows from a 15% to a 5% discount will generate a share price return of 29%, offering a significant kicker to performance. This approach is well-trodden ground for many professional, value-orientated investors and a real source of long-term performance. It is worth noting that open-ended funds will only ever generate the NAV performance and can not benefit from this scenario.
While risks persist for 2026 – including the unpredictable US administration, high valuations of US technology stocks, sticky inflation, and sluggish global growth – we remain optimistic about generating strong risk-adjusted returns. Our optimism is driven by the opportunity to capitalise on historically wide discounts and attractive dividend yields within the investment trust sector, our strategic positioning in undervalued UK and European markets, and meaningful exposure to alternative assets including precious metals and infrastructure that offer both income and inflation protection.
We anticipate corporate activity will remain elevated in 2026 as the sector consolidates, emerging “fitter, leaner, and stronger”.